Download and Installation
The complete ViewProp download can be found on the download page. Download it to your machine and copy the contents of the download (the Viewprop folder) to any location you wish, including Program Files.
Viewprop makes heavy use of the excellent mapping capabilities of DXAtlas by VE3NEA, which is shareware. A 30-day fully functional trial version can be downloaded from DXAtlas and uses a regular Windows installer. After the 30 days, a “forever license” is US$29.95. You must have DXAtlas installed on your machine, even if only a 30-day trial version, in order to run ViewProp.
Getting Started
We’re going to begin with a sort of minimal setup, to get you started with the key features of ViewProp. Later we’ll circle back to exploit all of the configuration options you can use to fit your needs best.
Open the ViewProp folder and run Viewprop.exe. Initially you’ll see this page, which is called the Path Grid. We’re only showing you the upper left-hand corner, to make it easier to read.
Now click on Setup in the topmost menu. That gives you a dropdown menu.
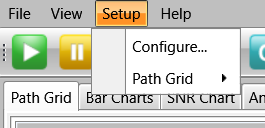
Click on Configure or the Gearwheel icon  that reveals another window, which looks like this:
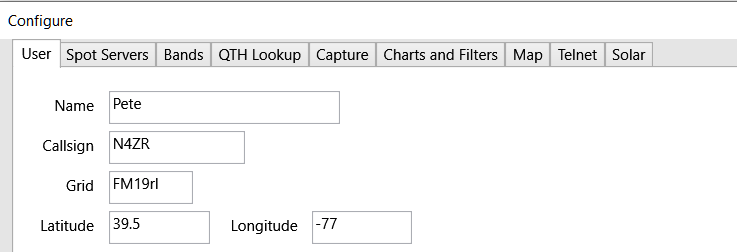
Start with the User tab, and fill in this dialog, which is pretty self-explanatory – N4ZR’s data are in the example). One trick – if you know your grid square but not your latitude and longitude, fill in your grid and tab down to the Latitude and Longitude boxes. The latitude and longitude of the center of your grid square will automatically be filled in. If you want to use a more precise location, tab down to both boxes and you can edit them.
Now move on to the next tab, titled Spot Servers:
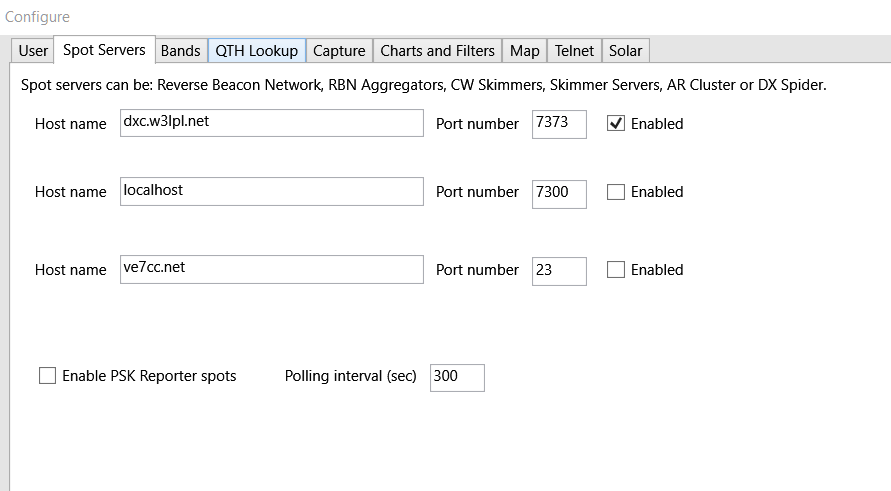
Again, this is pretty self-explanatory. Fill in the host names or IP addresses and port numbers of your favorite cluster node(s). As you can see from this illustration, N4ZR prefers ARCluster V6 and VE7CC nodes, because both have extensive filtering capabilities and carry Reverse Beacon Network (RBN) spots by default, but this is strictly up to you. If you get the same spot from more than one cluster, ViewProp will automatically de-dupe the data stream to keep the clutter down.
A quick aside – you’ll discover that you can’t enable or disable Spot Sources, or anything else on the Spot Servers, while the program is running. It won’t let you, and just greys out the relevant textboxes and checkboxes.
For the moment, we’ll bypass the check box to enable PSK reporter, which is provided to enable seeing FT4 and FT8 spots, and is a real firehose of data, but it is at least a way to generate a lot of spots in a hurry if you need them to demonstrate the capabilities of ViewProp, or to experiment with various functions.
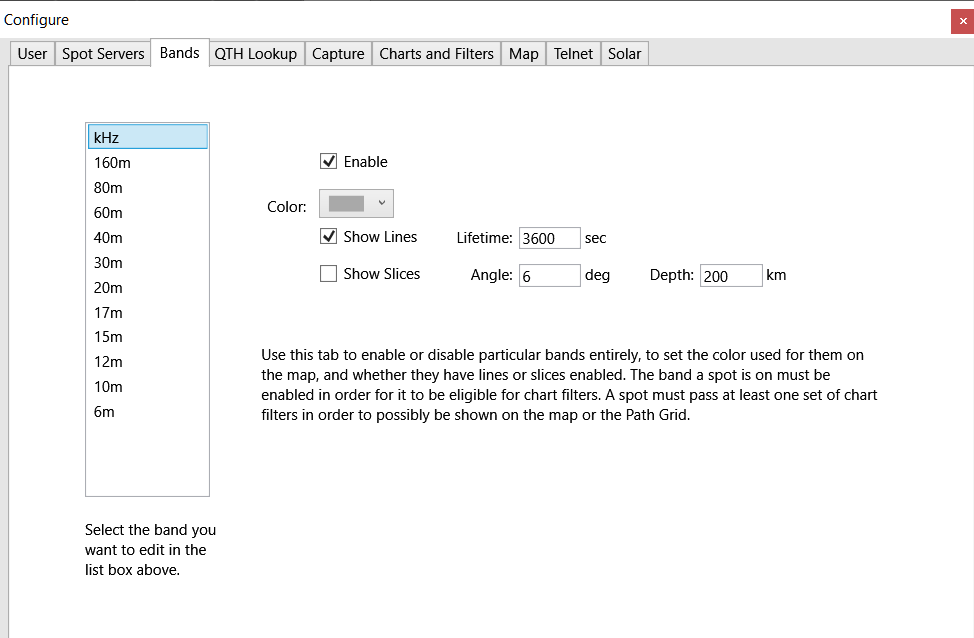
And now is where things get interesting, and a little complicated. Click on the Bands tab, and initially you’ll see this:
If you select a color for a particular band, like this for 160M:

then the color you choose on the Bands tab will be used on the Map and the SNR chart and the Legend to denote that band. Colors on the Charts and Filters tab are independent, and only apply to their corresponding bar chart. You need to click on each of the bands you want to monitor, check its Enable box, and decide whether to go with the default color or select a color from the drop-down list that appears by your clicking on the down arrow next to the color. If a band is not enabled, no spots from that band will
Only spots on enabled bands proceed to geolocation (QTH Lookup) on qrz.com, or to rough geolocation by ViewProp’s internal algorithms. Once geolocated, spots on enabled bands are eligible for what is called Capture (See the next Setup tab below).
Your next choice on this tab is the “Show Lines” checkbox. Unless you check this for a given band, the path (or line between the distant station’s QTH and the center of your Capture cente)r will not be shown on DXAtlas; if you do, it will be shown in the color you chose.
The default lifetime for the lines on the map is 3600 seconds or 60 minutes. You can choose less or more (in seconds) if you wish.
Your next choice is the “Show Slices” checkbox. Like “Show Lines”, this option also affects what you see on the map. Slices are a way of visually displaying the propagation that resulted in a particular spot. For example, this illustration from the map:
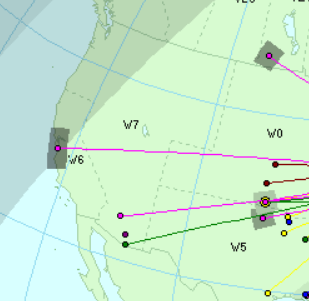
For example, this illustration shows “slices” surrounding the distant end of the plot of spots on the map. Nominally, these slices are set to be 6 degrees wide and 200 KM deep, to give a sense of areas that might have similar propagation, as seen from your home area. The darker the slice, the less strong the signal was when reported by a local spot.
Finally, on this tab are textboxes for the width of the slices, in angles of bearing, and for the depth, in kilometers. They only affect the way DXAtlas displays slices.
The next tab in Configure is QTH Lookup. There are two options here. If you want to just rely on ViewProp’s internal mechanisms to figure out where both ends of each path are, then you can just skip this tab altogether. If you want to have each QTH located more precisely, you can get an XML subscription to QRZ for $29.95 a year and check the Enable box. QRZ also offers free access to their XML subscription service, but it’s limited both in terms of the total number of lookups allowed and accuracy. It can be useful in spite of those limitations, though. That might be a good way to try out the service to decide whether you want to invest.
The next Setup tab (Capture] is crucial, because it decides which paths will be reported on the path grid, the bar charts and on the DXAtlas map. After all, you want to know what propagation might be available to you. The Maximum near-side spot distance defines the circle (typically around your QTH), where either a spotter or a spotted station is located. So if someone in Alaska, for example, spots someone inside your circle, that spot will become part of your base of information, and if someone inside your circle spots someone in Alaska, the same will happen. This is the feature that makes ViewProp truly unique in its ability to characterize propagation to and from your QTH.
Normally, you will want the origin of your circle to be at your QTH, but say you’re planning a DXpedition and want some advance idea of what the propagation will be like, you can use this feature to put your “location” anywhere on earth.
The next Setup tab is fiercely complicated. We’ll come back to this in detail later, but for now, just leave the defaults. Here’s the full tab:
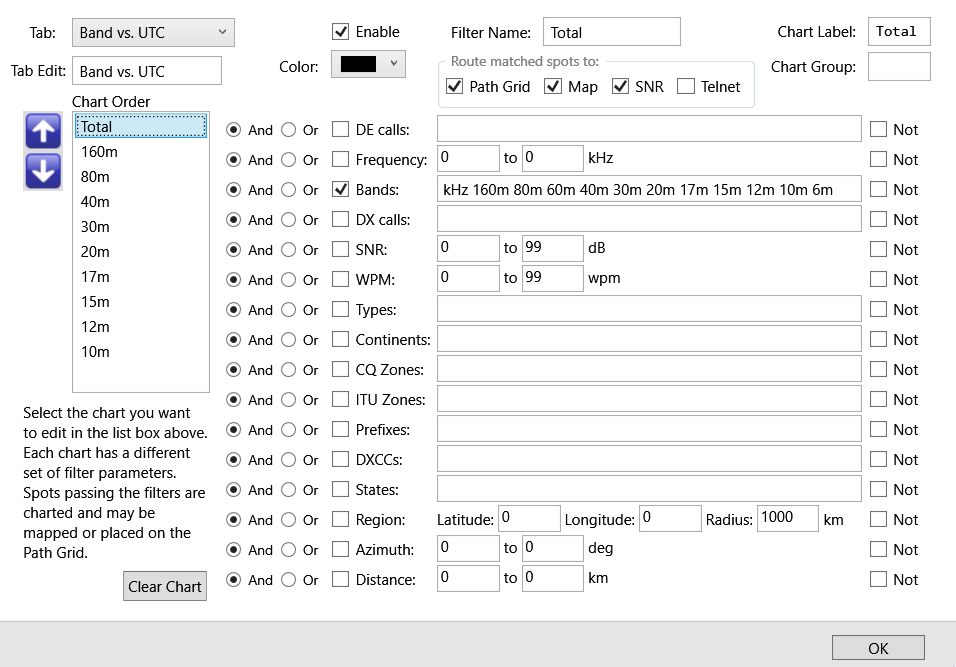
For now, just make sure the chart looks like this, which is the default. The frequency bands are provided automatically by ViewProp.
The next tab, titled “Map” controls a number of options in DXAtlas. The choices are basically self-explanatory.
The next one, “Telnet”, is for setting up a local telnet server, for example to feed the filtered spots to your logging program. And finally (!), the Solar tab has just a single textbox, to enable space environment reporting – more on that later too.
So now we’re ready to run ViewProp for the first time. Close the Setup menu and the Path Grid reappears by default. Click the big green arrow at the upper left, and Viewprop will begin processing spots (a point here – when you stop the program by clicking on the yellow Pause icon, you can click it again to restart). The Path Grid will begin to fill up, and it will look like this:
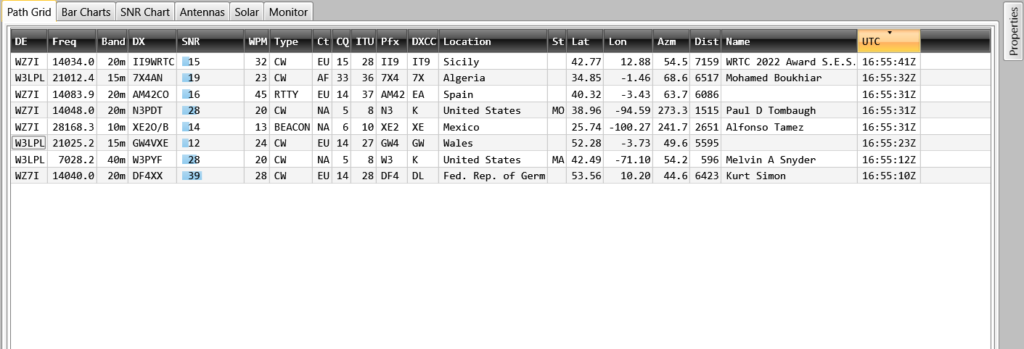
The type is a little small in this format, so let’s explain the parts that may not be self-explanatory:
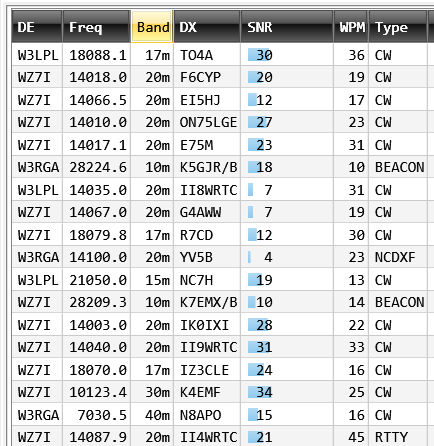
In this closer look, the most important part is the Type column. It tells you the mode and whether the station was a beacon, such as the NCDXF system or individual ones, which will probably be spotted more often as the higher bands become more active.
Another twist is the way Viewprop displays inverted spots – where the spotter is elsewhere and the station being spotted is inside your origin circle. These are an essential part of ViewProp’s ability to visualize propagation to/from a given location. Here’s an example:
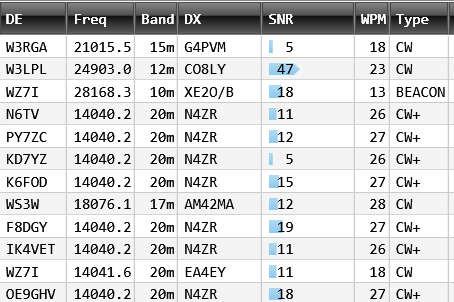
These inverted spots are flagged by the “+” sign in the Type column – as you can see, N4ZR sent a CQ, in order to cause some of these for purposes of this manual.
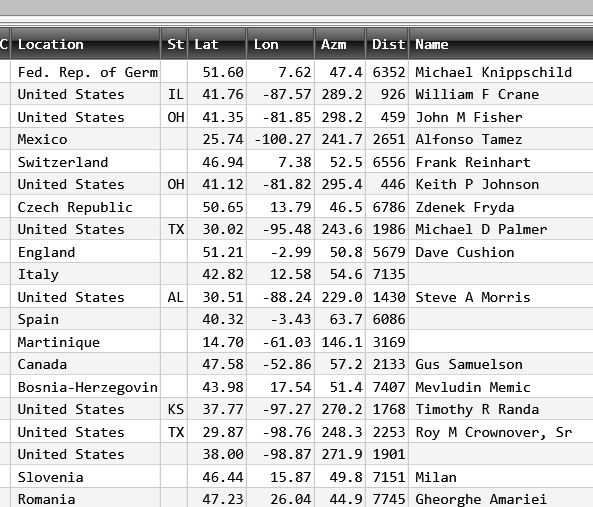
This is the right side of the Grid, a little later. A lot of this information is derived either from QRZ lookups or from ViewProp’s internal processes. Name and location are cached for the prior 30 days.
In instances where QRZ lookups are not available and Viewprop’s internal algorithms are used to determine location, you’ll see no name in the right-most column, and typically the location defined by latitude and longitude is the center of the country or call area of the station. Distances are in kilometers.
